Introduction
Gestational diabetes mellitus (GDM) is characterized by glucose intolerance during pregnancy.1 The prevalence of GDM is 5.8–25.5% worldwide.2 The reasons for such increase include delayed pregnant age, obesity, and family history of type 2 diabetes mellitus (T2DM).2,3 GDM contributes to many perinatal complications and increases the risk of future maternal and infant metabolic diseases in the future.3
GDM is usually detected using the oral glucose tolerance test (OGTT) and diagnosed during 24–28 weeks of pregnancy, leaving a limited time for intervention. Thus, it is important to identify the risk of GDM by using a simple and practical method during the first trimester in clinical practice. Several studies have investigated GDM prediction models.4–6 However, few studies have considered the clinical indicators, glucose and lipid metabolism, and body composition into consideration together.
Obesity before pregnancy is a risk factor for the development of GDM. Although body mass index (BMI) is widely used, it does not distinguish fat mass (FM) or skeletal muscle mass (SMM). Maternal obesity and visceral adipose tissue (VAT) are associated with insulin resistance and metabolic disorders7 and are good predictors of GDM risk.8,9 However, some pregnant women are lean, and inadequate muscle mass might be the reason because muscles participate in glucose metabolism and are associated with insulin resistance.10 Therefore, identifying and qualifying body composition in early pregnancy is important for predicting GDM.
Glucose and lipid metabolism are associated with GDM.11,12 Glycated albumin (GA) is the product of non-enzymatic glycosylation of plasma albumin and reflects the blood glucose level in the preceding 2–3 weeks,13 which is more sensitive to glucose monitoring than HbA1c.14 Thus, it is widely used to monitor glucose control during pregnancy, but the predictive ability of GA in the first trimester for GDM has not been fully studied. Maternal lipid metabolism increases with gestational age physiologically, but excessive TG level contributes to subsequent GDM development.11,15
Abnormal body composition, glucose, and lipid metabolism contributed by undesirable dietary habits and sedentary lifestyles could be intervened; therefore, it is important to identify the risk factors for GDM. In this study, we investigated the relationship between glucose and lipid metabolism, body composition measured using mBIA during early pregnancy, and the development of GDM.
Materials and Methods
Study Population
This was a prospective, observational study; 20–45 years old singleton pregnant women who visited the Obstetrics Department of Peking Union Medical College Hospital for routine appointments were invited to participate in the study if they were between 6 and 12 weeks of gestation. Women were excluded if they had pre-existing diabetes and other endocrine diseases (eg, asthma, abnormal thyroid function, Cushing’s syndrome, PCOS), corticosteroid adoption, severe internal and external diseases (eg, hypertension, cardiovascular diseases, hematological diseases, renal diseases, and liver function abnormality), or severe operation history in the recent half-year. All pregnant women were followed-up until they completed a 75-g OGTT at 24–28 weeks of gestation. Subjects who could not complete the blood test, body composition test, or follow-up were excluded from the study. This study was approved by the Ethics Committee of Peking Union Medical College Hospital (No. ZS-1703), and the study complies with the Declaration of Helsinki. All participants provided written informed consent before participation. This study was registered at ClinicalTrials.gov (http://www.clinicaltrials.gov) (NCT 04550806).
The sample size was calculated using the Power Analysis and Sample Size (PASS) 11.0 software with Tests for Two Proportions, where α= 5%, power=80%, RR=2.04,9 and dropping rate=10%. In total, 295 participants were included in this study.
Data Collection
Data on age, pregnancy weeks, family history of T2DM, medical history, and GDM history were collected from medical records, and weight before pregnancy was self-reported. At the first prenatal visit, weight and body composition were measured using multi-frequency bioelectrical impedance analysis (mBIA, Inbody 770, Inbody, Seoul, Korea). All participants were instructed to be in a fasting state (consumption of water was allowed until 2-hour before testing) and abstain from strenuous exercise for 48 hours prior to measurement. They removed jewellery and heavy clothing, and stood on the mBIA machine with bare feet. Fasting blood samplings, including fasting plasma glucose (FPG), GA, low-density lipoprotein cholesterol (LDL-C), high-density lipoprotein cholesterol (HDL-C), low-density lipoprotein cholesterol (LDL-C), total cholesterol (TC), and triglyceride (TG) levels, were collected in the morning and measured by the clinical lab of our hospital within 1 hour of blood collection. The plasma lipids and GA levels were detected by using the commercial enzymatic assays (Sekisui, Japan; Asahi Kasei Pharma Corporation, Japan), and glucose levels were detected by applying an automated analyzer (Beckman Coulter, US). Blood specimens were retained for seven days for necessary repeat if the result was irregular. GDM was diagnosed via 75-g OGTT test using the 2010 International Association of Diabetes and Pregnancy Study Groups (IADPSG) criteria when one or more of the following conditions were at or above the thresholds: FPG 5.1 mmol/L, 1-h plasma glucose 10.0 mmol/L, and 2-h plasma glucose 8.5 mmol/L.1 All data were collected, recorded, and organized by two researchers to avoid mistakes.
All participants were provided with healthy lifestyle advice by a qualified dietitian to fulfill the pregnancy requirement of appropriate energy (25–35 kcal/kg/day depending on their pre-BMI), high-quality protein, nutrients, and to avoid unhealthy food.16 Nutritional counseling was conducted after screening at admission; therefore, the grouping remained unknown.
Statistical Analysis
Normality tests were performed to determine whether the data were parametric or not. Normally distributed measurement data are presented as mean ± standard deviation (SD), and the differences between the GDM and non-GDM groups were examined using Student’s t-test. Non-normally distributed data are presented as median and interquartile range (IQR), and the difference between the two groups was examined using the Mann–Whitney test. Categorical variables were compared using the chi-square test (χ2).
Spearman’s rank correlation analysis was used for investigating the relationships between GDM and clinical data. Factors found to be statistically significant according to univariable Poisson regression (P≤0.10) or considered clinically important based on previous studies were included into multivariate Poisson regression analysis. The strength of the association between variables and GDM was expressed as relative risk (RR) with corresponding 95% confidence intervals (95% CI). The performance of the final optimized prediction model was evaluated using receiver operating characteristic (ROC) curves to estimate the area under the curve (AUC) and 95% CI. The cut-off value of relative variables was calculated based on ROC. All analyses were performed using SPSS (version 18.0; SPSS Inc., Chicago, IL, USA). A two-sided P<0.05 was considered statistically significant.
Results
Subjects
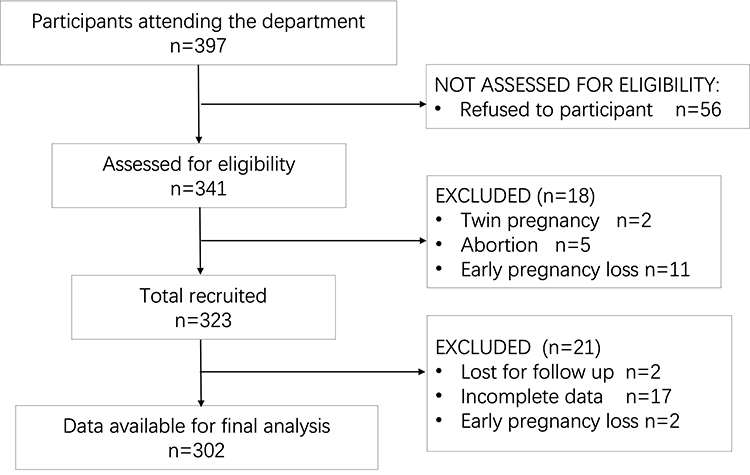
From October 2020 to January 2022, 323 pregnant women were included, but 17 lacked data and were excluded from the analysis; two pregnant women had fetal arrest, and two were lost to follow-up. The recruitment for this study was based on the STROBE guidelines,17 and 302 participants were included in the final analysis. The median (IQR) duration of follow-up of participants was 117.3 (IQR 99.5–139.1) days. Fifty-nine women (19.5%) developed GDM and were included in the observational group, while patients with normal glucose tolerance (NGT) were included in the control group (Figure 1).
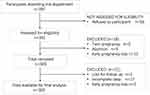 |
Figure 1 Flowchart showing recruitment in the study according to STROBE guideline.17
|
Demographic Characteristics
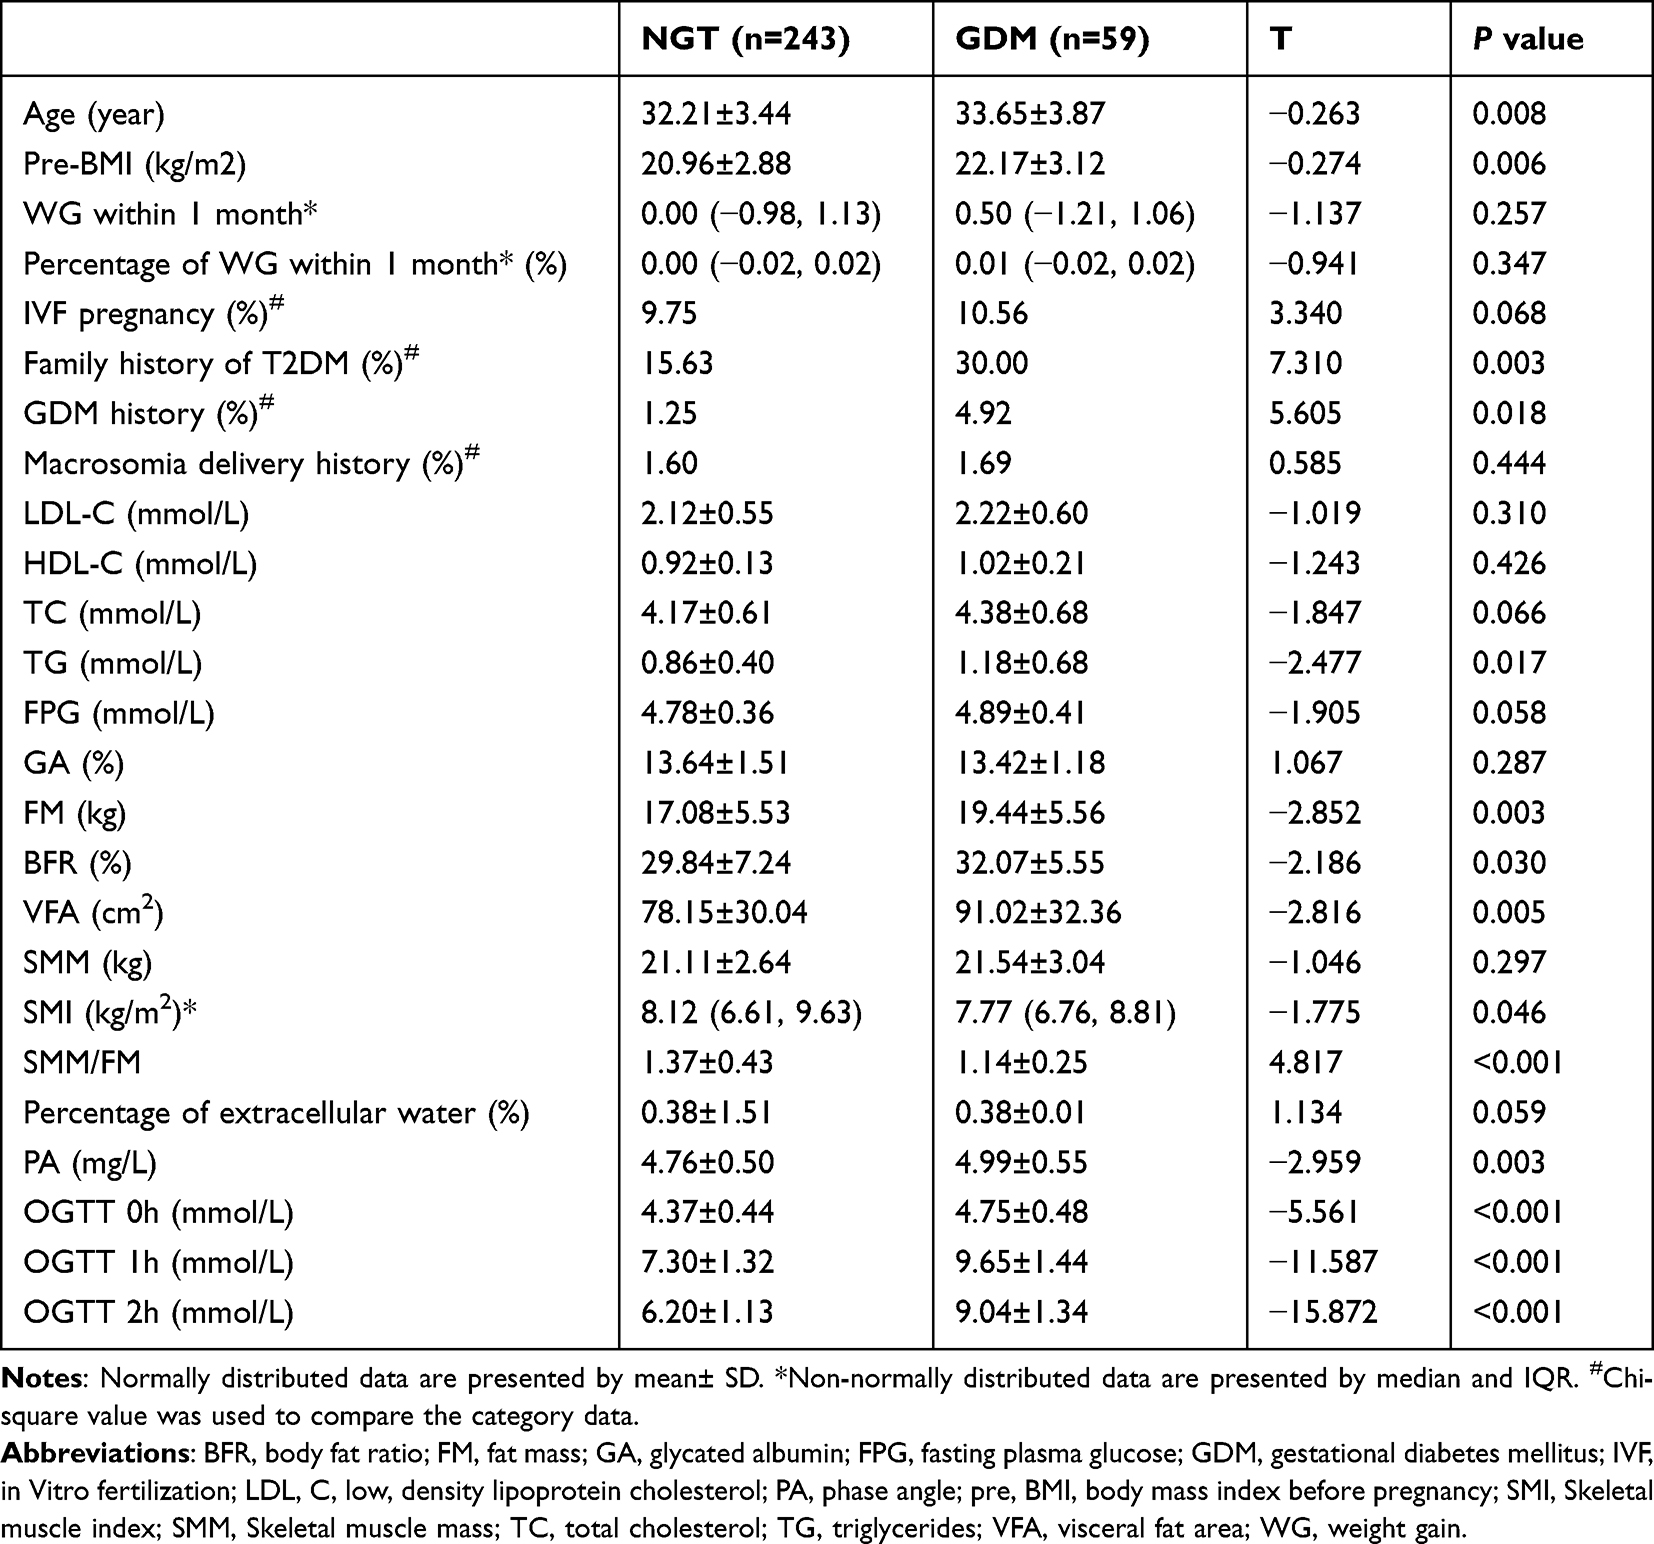
The characteristics of all participants according to the GDM diagnosis are shown in Table 1. Women with GDM were older (P=0.008) and had higher pre-BMI (P=0.006) and TG (P=0.017) than the NGT group, while TC (P=0.066), LDL-C (P=0.310), and HDL-C (P=0.426) levels did not differ between the two groups. There was no significant difference in GA (P=0.287) or FPG (P=0.058) during the early gestational weeks either. Subjects with or without GDM, in terms of weight gain (WG) or percentage of WG within the previous month, were similar. The percentage of positive history of GDM and a family history of T2DM was higher in the GDM group than in the NGT group (P<0.05). However, the percentage of in vitro fertilization (IVF) pregnancy or macrosomia delivery history did not differ between the two groups. The 0, 1-hour, and 2-hour glucose levels were significantly higher in subjects with GDM than in those with NGT in the OGTT (P<0.001).
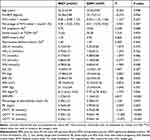 |
Table 1 Characteristics of GDM and Non-GDM Group
|
With respect to body composition, FM, body fat ratio (BFR), phase angle (PA), and visceral fat area (VFA) at early gestational weeks were significantly higher in the GDM group (P=0.003, 0.030, 0.003, and 0.005, respectively). Although SMM was not significantly different, SMI and SMM/FM were lower in the GDM group (P=0.046, P<0.001) (Table 1).
Risk Factors Associated with the Development of GDM
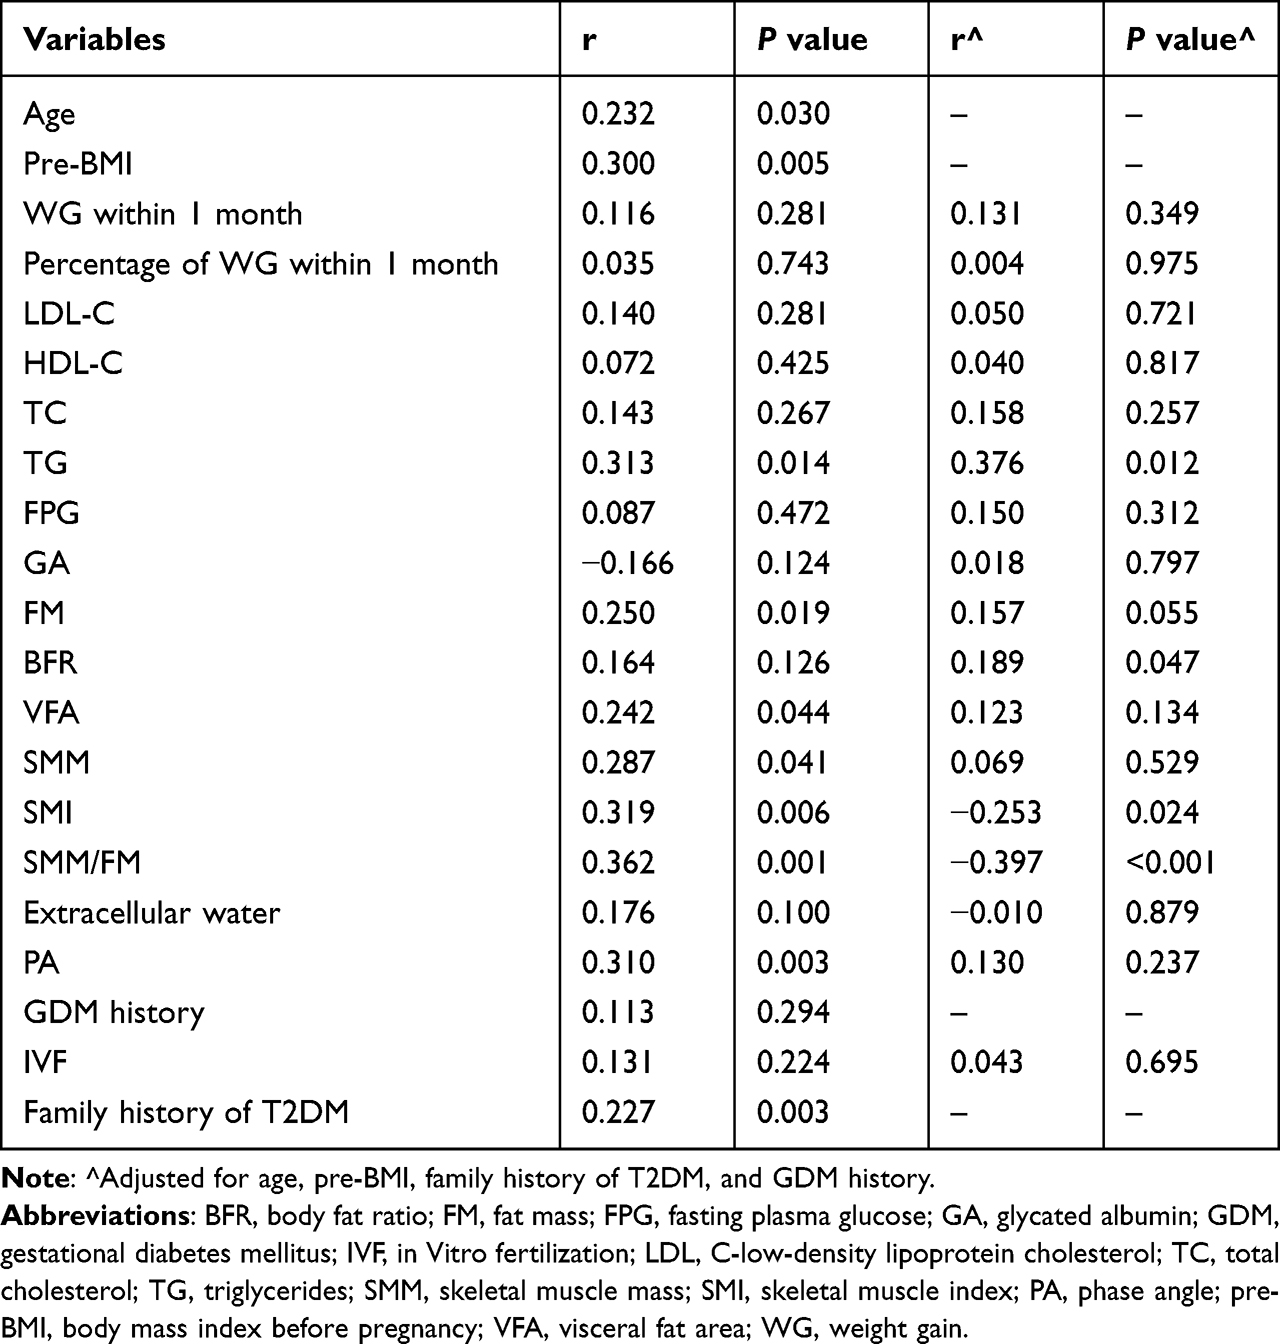
Correlation analysis showed a significant correlation between GDM and age, pre-BMI, TG, FM, BFR, VFA, SMM, SMI, SMM/FM, PA, and a family history of T2DM (Table 2). Adjusted for covariates, such as age, pre-BMI, family history of T2DM, and GDM history, there was a positive correlation between GDM diagnosis and TG and BFR, and a negative correlation between GDM and SMI and SMM/FM. Moreover, neither GA nor FPG levels in early pregnancy correlated with GDM diagnosis. According to ROC curve, AUC of SMM/FM was 0.629 (0.547, 0.712), and the cut-off values of SMM/FM was 1.305. Therefore, we compared the incidence of GDM in the groups with SMM/FM <1.305 and ≥1.305, and found a percentage of 34.4% and 15.7%, respectively.
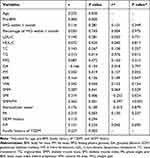 |
Table 2 Pearson’s Correlation Analysis Associated with GDM Diagnosis
|
The associations between age, pre-BMI, FPG, TG, BFR, VFA, SMI, SMM/FM, GDM history, IVF pregnancy, and family history of T2DM and GDM diagnosis were significant (all P<0.05) according to Poisson regression analysis, and all of these significant variables were entered into the multivariable model (see Table 3). In multivariable Poisson regression model, for each unit increase in age and pre-BMI, there was 7.6% (95% CI 1.005–1.152) and 1.2% (95% CI 1.005–1.063) increase in the risk of GDM. Simultaneously, the RRs for TG and family history of T2DM were 4.052 (95% CI 1.641–6.741) and 1.496 (95% CI 1.014–2.667). SMM/FM was a protective factor for GDM (RR 0.213 (95% CI 0.051–0.890)). In contrast, RRs for VFA, SMI, IVF pregnancy and GDM history were null in multi-factor regression analysis. Although GDM history was not significant in this study, it was regarded as a strong clinical indicator of GDM development; thus, it was included in the regression model (Table 3). According to ROC curve, the cut-off values of TG were 110.95cm2.
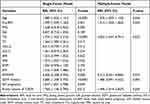 |
Table 3 Poisson Regression Analysis
|
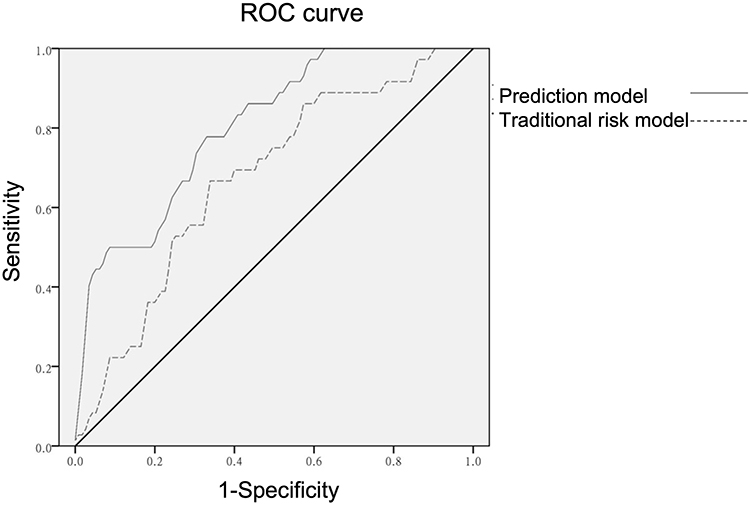
The predictive model was statistically significant (χ2 = 37.743, P<0.001), explained 33.2% (R2) of the variance in GDM, and correctly classified 83.4% of the cases. The performance (AUC) of the prediction model was 0.806 (95% CI 0.737–0.895, P<0.001), with 77.8% sensitivity and 67.8% specificity. The predictive ability of the variables to classify between the GDM and NGT groups was better than that of the conventional risk model with an AUC of 0.673 (95% CI 0.576, 0.770), which included age, pre-BMI, GDM history, family history of T2DM, and macrosomia delivery history (Figure 2). Sensitivity and specificity terms for individual predictive variables. ROC curves were generated for age, pre-BMI, VFA, SMM/FM, and TG; however, any individual variable showed poor discrimination (Table 4).
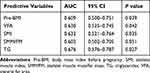 |
Table 4 AUC for Variables Computed with ROC Analysis for GDM
|
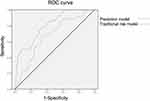 |
Figure 2 ROC curves for the accuracy of the GDM prediction model.
|
Influencing Factors of GA
Because the negative results of GA for GDM prediction were rather unexpected, we analysed some of the influencing factors of GA. The univariate correlation analysis showed a negative correlation between the pre-BMI, lipids, FM, FR, VFA, SMM, SMI, PA with GA (all P≤0.01). After adjustment for age and pre-BMI, the negative correlation between TC, VFA, SMI, PA and GA remained (P<0.05) (Supplementary Table 1).
Discussion
This study reported a high incidence of GDM and explored the predictive effects of glucose and lipid parameters, and body composition measurements for GDM. Lower SMM/FM and higher TG levels were risk factors for GDM; however, FPG or GA in early gestation was not associated with GDM development.
First, the incidence of GDM was found 19.5%, which was comparable to a previous report and should be awaited because Chinese individuals are at a high risk for GDM.18 We confirmed that conventional risk factors were associated with GDM development, consistent with previous studies5 and clinical practice observations. However, owing to the limited number of events, IVF pregnancy or macrosomia delivery history was not found to be significantly related to GDM in this study.
Second, body composition is associated with the risk of developing GDM. Several studies have shown that FM, VFA, subcutaneous adipose tissue thickness, and body fat index are good markers of GDM development.4,9 Here, we found that higher FM and VFA levels correlated with GDM after adjusting for pre-BMI and age. Moreover, adipose tissue, especially VFA, is associated with inflammation and insulin resistance,7 making people more likely to develop abnormal glucose metabolism. However, in the Poisson regression analysis, VFA in early pregnancy was no longer a risk factor for GDM development in this study. Skeletal muscle is responsible for the greatest insulin-stimulated glucose disposal in the body10 and is associated with the risk of diabetes.19 In addition, skeletal muscle regulates systemic insulin sensitivity through the secretion of myokines, such as musclin, IL-6, and TNFα.19,20 There are several measurements of muscles in practice, including absolute SMM, SMI, and the percentage of SMM. In our study, lower SMI than SMM was a risk factor for GDM development. Notably, adipose tissue and skeletal muscle have opposite roles in insulin sensitivity,19 and there is a positive correlation between FM and SMM (r=0.628, P=0.014, results not shown); therefore, we further analyzed the ratio of SMM to FM and confirmed the negative relationship between GDM and SMM/FM, which was also positively associated with insulin sensitivity.10 Fasting insulin levels were found to be significantly higher in GDM subjects than in NGT ones.21 Therefore, SMM/FM is useful in predicting GDM and may be a target for nutritional interventions. The cut-off value of SMM/FM from this study was 1.305, thus we will verify the validity of this cut-off value in larger sample sizes and more centers in further study. Although body composition measurement via mBIA in pregnant women is not a part of routine clinical practice, we can still do the manual measurements for muscle and fat mass, such as calf circumference, mid-upper arm circumference, waist circumference, etc.
Third, we identified an association between TG levels and GDM development, even after adjusting for age and pre-BMI. Although we further adjusted for BFR and VFA, TG levels remained associated with GDM development (r=0.212, P=0.009). Several studies suggested TG could be a risk factor for GDM.11,15 In this study, the cut-off value was 0.925 mmol/L, which is lower than the reference range for healthy adult, indicating it may be necessary to set lower standards for maternal lipids in early pregnancy to avoid possible insulin resistance and GDM. These findings, including higher adiposity and lipid levels, presumably reflect the potential pathophysiological pathways of GDM, which include the onset of insulin resistance, chronic inflammation, and adipocytokines,11,22 but maternal lipids are not yet recognized as risk factors, nor are they currently targeted for intervention in early gestation.
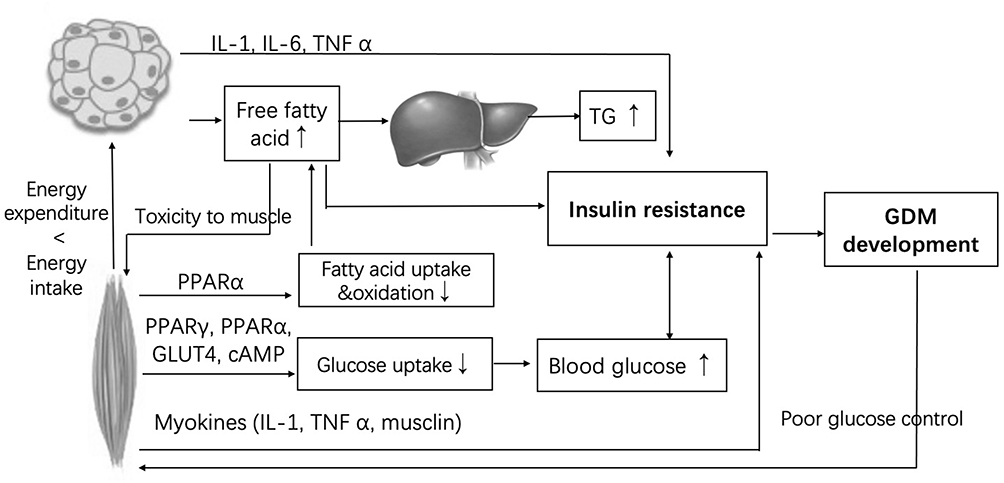
Muscle mass has a positive effect on insulin sensitivity, but such a protective association seems to work among lean subjects but not in subjects with excessive fat.19 Cross-talk between muscle and fat via inflammatory factors and insulin resistance has been observed,23 reflecting the importance of intervention for both muscle and fat, as well as glucose and lipid metabolism. As an important organ for energy consumption, low SMM results in low energy expenditure; thus, fat accumulates from excessive energy. In addition to regulating glucose metabolism, the skeletal muscle influences fatty acid uptake and oxidation via peroxisome proliferator-activated receptor (PPAR)-α, PPARγ coactivator 1α, glucose transporter 4 (GLUT4), and cyclic adenosine monophosphate (cAMP) response element-binding protein.24 Thus, metabolic alterations in skeletal muscle strongly affect glucose and lipid homeostasis. Moreover, the increase in VAT and insulin resistance results in a higher release of free fatty acids (FFA) into circulation, resulting in higher synthesis of TG, toxicity in the muscle, and insulin resistance,23 resulting in a reduced capacity for glucose and lipid metabolism (Figure 3). In this study, when we conducted the ROC of individual risk factors of GDM, the AUCs were lower than 0.7, whereas when we combined the factors, the prediction power improved, which was higher than the AUC of body composition alone in a Chinese population (0.672).9 Although some previous studies may have obtained higher AUCs for GDM prediction, manual body composition measurements conducted in some studies are time-consuming,4 and some biomarkers are not routinely tested in clinics.5,6
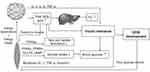 |
Figure 3 Relationships between adipose tissue, skeletal muscle, blood glucose and TG. This figure summarizes the relevance of inadequate muscle to increased blood glucose and FFA, and insulin resistance via inflammation and cytokines; and the relevance of excessive of adipose tissue to the increased TG and insulin resistance via inflammatory pathways. High level of FFA can cause hypertriglyceride, insulin resistance, and toxicity to muscle directly. Poor glucose control will lead to muscle loss.
|
Although GA and FPG were widely adopted in clinics for glucose assessment, GA or FPG in early pregnancy was not a good indicator for GDM in our study and previous studies.25,26 It might be due to the physiological fluctuation of maternal glycemia in the first trimester.27 Furthermore, GA was found to be associated with BMI, BFM, VFA, and SMM, so body composition and chronic inflammation status might be another influencing factors.
This study is the first to report the role of SMM/FM in predicting GDM and to emphasize the importance of skeletal muscle and fat in GDM development. The current predictors for GDM provide important pathophysiological insights into GDM and potential treatment targets for nonglycemic intervention, and also arouse the attention of obstetricians and dietitians to consider glucose and lipid metabolism, weight, muscle, and fat change simultaneously. In addition, the required sample size was calculated in advance, and the blinding process between mBIA measurement, blood tests, and OGTT was performed, making the study reliable.
The study was performed at a single center and was limited to a single ethnicity; thus, the results may not be generalizable to other populations. Owing to the limitations of mBIA, body composition may not be accurate; however, it is safer and more convenient than CT or DEXA for pregnancies and is widely used in clinics. The study design did not include follow-up in the second trimester of pregnancy; if this was done, we could evaluate the role of the change in variables in GDM development. Moreover, although we found a high risk of inadequate muscle for GDM development and hypothesized the potential role of insulin resistance, fasting insulin and homeostatic model assessment (HOMA) were not evaluated, which could be done in future studies.
Conclusions
SMM/FM, VFA, and TG levels are risk factors for GDM development, emphasizing the importance of improving body composition and lipid metabolism in early pregnancy, and could be used as important indicators of nutritional intervention for pregnant women with GDM risk.
Data Sharing Statement
The data underlying this study are available for ten years from the corresponding author upon reasonable request.
Author Contributions
FW and YB conducted the study. All authors contributed to data analysis, drafting, and revising the article, have agreed on the journal to which the article will be submitted, gave final approval of the version to be published, and agreed to be accountable for all aspects of the work.
Funding
This work was supported by National High Level Hospital Clinical Research Funding (no. 2022-PUMCH-B-055). The funding sources had no role in the study design, data collection, analysis, or writing of this report. We would like to thank all the participants of this study for their collaborative trials.
Disclosure
The authors declare no conflicts of interest.
References
1. American Diabetes Association Professional Practice Committee. 2. Classification and diagnosis of diabetes: standards of medical care in diabetes-2022. Diabetes Care. 2022;45(Suppl 1):S17–S38. doi:10.2337/dc22-S002
2. Wang H, Li N, Chivese T, et al. IDF Diabetes Atlas: estimation of global and regional gestational diabetes mellitus prevalence for 2021 by International Association of Diabetes in Pregnancy Study Group’s Criteria. Diabetes Res Clin Pract. 2022;183:109050. doi:10.1016/j.diabres.2021.109050
3. Johns EC, Denison FC, Norman JE, Reynolds RM. Gestational diabetes mellitus: mechanisms, treatment, and complications. Trends Endocrinol Metab. 2018;29(11):743–754. doi:10.1016/j.tem.2018.09.004
4. Cremona A, O’Gorman CS, Ismail KI, et al. A risk-prediction model using parameters of maternal body composition to identify gestational diabetes mellitus in early pregnancy. Clin Nutr ESPEN. 2021;45:312–321. doi:10.1016/j.clnesp.2021.08.002
5. Correa PJ, Venegas P, Palmeiro Y, et al. First trimester prediction of gestational diabetes mellitus using plasma biomarkers: a case-control study. J Perinat Med. 2019;47(2):161–168. doi:10.1515/jpm-2018-0120
6. Corcoran SM, Achamallah N, Loughlin JO, et al. First trimester serum biomarkers to predict gestational diabetes in a high-risk cohort: striving for clinically useful thresholds. Eur J Obstet Gynecol Reprod Biol. 2018;222:7–12. doi:10.1016/j.ejogrb.2017.12.051
7. Bandres-Meriz J, Dieberger AM, Hoch D, et al. Maternal obesity affects the glucose-insulin axis during the first trimester of human pregnancy. Front Endocrinol. 2020;11:566673. doi:10.3389/fendo.2020.566673
8. De Souza LR, Berger H, Retnakaran R, et al. First-trimester maternal abdominal adiposity predicts dysglycemia and gestational diabetes mellitus in midpregnancy. Diabetes Care. 2016;39(1):61–64. doi:10.2337/dc15-2027
9. Liu Y, Liu J, Gao Y, et al. The body composition in early pregnancy is associated with the risk of development of gestational diabetes mellitus late during the second trimester. Diabetes Metab Syndr Obes. 2020;13:2367–2374. doi:10.2147/DMSO.S245155
10. Kawanabe S, Nagai Y, Nakamura Y, Nishine A, Nakagawa T, Tanaka Y. Association of the muscle/fat mass ratio with insulin resistance in gestational diabetes mellitus. Endocr J. 2019;66(1):75–80. doi:10.1507/endocrj.EJ18-0252
11. Sweeting AN, Wong J, Appelblom H, et al. A novel early pregnancy risk prediction model for gestational diabetes mellitus. Fetal Diagn Ther. 2019;45(2):76–84. doi:10.1159/000486853
12. Sesmilo G, Prats P, Garcia S, et al. First-trimester fasting glycemia as a predictor of gestational diabetes (GDM) and adverse pregnancy outcomes. Acta Diabetol. 2020;57(6):697–703. doi:10.1007/s00592-019-01474-8
13. Koga M, Saito H, Mukai M, Matsumoto S, Kasayama S. Influence of iron metabolism indices on glycated haemoglobin but not glycated albumin levels in premenopausal women. Acta Diabetol. 2010;47(Suppl 1):65–69. doi:10.1007/s00592-009-0123-6
14. Ortiz-Martínez M, González-González M, Martagón AJ, Hlavinka V, Willson RC, Rito-Palomares M. Recent developments in biomarkers for diagnosis and screening of type 2 diabetes mellitus. Curr Diab Rep. 2022;22(3):95–115. doi:10.1007/s11892-022-01453-4
15. Zhu H, He D, Liang N, Lai A, Zeng J, Yu H. High serum triglyceride levels in the early first trimester of pregnancy are associated with gestational diabetes mellitus: a prospective cohort study. J Diabetes Investig. 2020;11(6):1635–1642. doi:10.1111/jdi.13273
16. American Diabetes Association Professional Practice Committee. 15. Management of diabetes in pregnancy: standards of medical care in diabetes-2022. Diabetes Care. 2022;45(Suppl 1):S232–S243. doi:10.2337/dc22-S015
17. Vandenbroucke JP, von Elm E, Altman DG, et al. Strengthening the Reporting of Observational Studies in Epidemiology (STROBE): explanation and elaboration. Int J Surg. 2014;12(12):1500–1524. doi:10.1016/j.ijsu.2014.07.014
18. Hedderson M, Ehrlich S, Sridhar S, Darbinian J, Moore S, Ferrara A. Racial/ethnic disparities in the prevalence of gestational diabetes mellitus by BMI. Diabetes Care. 2012;35(7):1492–1498. doi:10.2337/dc11-2267
19. Shin Y, Moon JH, Oh TJ, et al. Higher muscle mass protects women with gestational diabetes mellitus from progression to type 2 diabetes mellitus. Diabetes Metab J. 2022;46(6):890–900. doi:10.4093/dmj.2021.0334
20. Wu H, Ballantyne CM. Skeletal muscle inflammation and insulin resistance in obesity. J Clin Invest. 2017;127(1):43–54. doi:10.1172/JCI88880
21. Adam S, Pheiffer C, Dias S, Rheeder P. Association between gestational diabetes and biomarkers: a role in diagnosis. Biomarkers. 2018;23(4):386–391. doi:10.1080/1354750X.2018.1432690
22. de Gennaro G, Palla G, Battini L, et al. The role of adipokines in the pathogenesis of gestational diabetes mellitus. Gynecol Endocrinol. 2019;35(9):737–751. doi:10.1080/09513590.2019.1597346
23. Li CW, Yu K, Shyh-Chang N, et al. Pathogenesis of sarcopenia and the relationship with fat mass: descriptive review. J Cachexia Sarcopenia Muscle. 2022;13(2):781–794. doi:10.1002/jcsm.12901
24. Baskin KK, Winders BR, Olson EN. Muscle as a “mediator” of systemic metabolism. Cell Metab. 2015;21(2):237–248. doi:10.1016/j.cmet.2014.12.021
25. Zhu WW, Yang HX, Wei YM, et al. Evaluation of the value of fasting plasma glucose in the first prenatal visit to diagnose gestational diabetes mellitus in China. Diabetes Care. 2013;36(3):586–590. doi:10.2337/dc12-1157
26. Zhu J, Chen Y, Li C, Tao M, Teng Y. The diagnostic value of glycated albumin in gestational diabetes mellitus. J Endocrinol Invest. 2018;41(1):121–128. doi:10.1007/s40618-016-0605-7
27. Lain KY, Catalano PM. Metabolic changes in pregnancy. Clin Obstet Gynecol. 2007;50(4):938–948. doi:10.1097/GRF.0b013e31815a5494